Splunk#
Installation#
Head to https://www.splunk.com/ and create a free account
Download the .deb from the same location (or wget, they provide a nice link)
Chmod +x [file]
Install
sudo dpkg -i [file]
Its now installed in /opt/splunk
Can now launch by running the below in the /opt/splunk/bin directory (need sudo on first run)
./splunk start –accept-license
You’ll be asked for the first admin account. Default is ‘admin’ with your password
Your service is now started at localhost:8000
Splunk Components#
Splunk consists of 3 components, the Indexer, Search and Forwarder.
Forwarder#
The forwarder is simply an agent that is installed on the endpoint to be monitored, or forwarded from other instances. The agent is “very lightweight” (it’s not really) and forwards events to the Splunk server. End points include
A web server generating/recieving web traffic
A windows machine with Event Logs, sysmon, powershell etc
A linux host with its internal logs
A DB server with requests, responses and errors
Indexer#
The indexer processes the data it recieves and converts it to a standard format (normalising). This includes creating Key/Value pairs, determining the data type and storage to its internal DB. This is in preparation for the next component.
Search (Search Head)#
Well whats the point in all of this data if you can’t search it or apply other rules? This is where the search head comes in. It can also convert the data for visualistions, export and other such tasks. You can think of this as the “GUI” of Splunk, and it is where we will spend most of our time. Throughout this page, when I’m refering to “Splunk”, it is this web GUI.
Navigation#
Home Page#
The home page is quite straight forward. The bar at the top is refered to as the “Splunk Bar”. The Navigation bar on the Left is the “Apps Panel”.
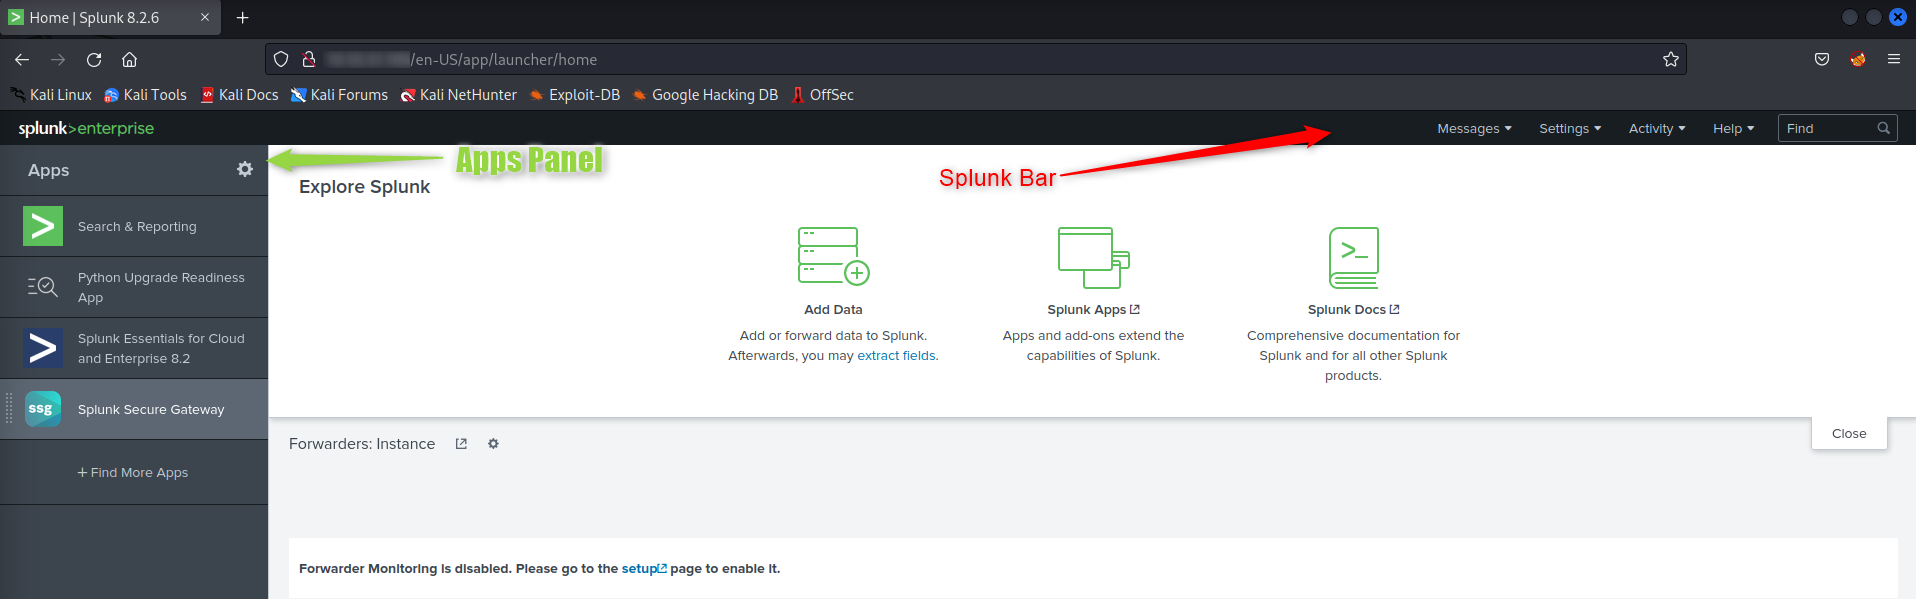
The main section above (the “explore splunk”) can be replaced with a default dashboard. THe Dashboard studio can assist with this (or just update your splunk versions and you can see it on the home page). Once we upload our data, there is a bit of configuration needed
Loading Data#
Most of the time we will be bringing in Data from the indexers, but to get some initial demo data we can load this in. If you’re going through job interviews, this will probably be your first step too.
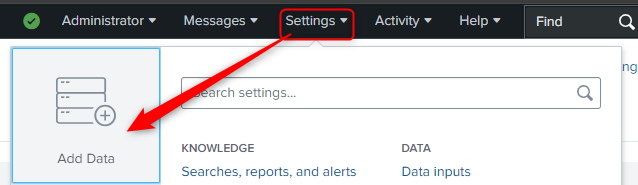
On the Splunk home page, once logged in you can select “Add Data” or go to Settings -> Add Data.
Select the “Source” -> Where are we getting the data from (Such as ‘uploaded file’)
Select the “Source Type” -> What data are we loading in
Add the “Input Settings” -> What host was it and what Index should be used
Check it all, and go “Done”
SPL - Search Programming Language#
SPL Consists of 5 components
Search Terms
Commands
Functions
Arguements
Clauses
When running a search, you can have one or more of these. The are separated by pipes in the search (as an AND)
Search Terms#
Wildcard * are supported
Boolean (AND, OR, NOT) are supported
“Quotes” are supported
Can escape quotes in search with a \
Can do () to make order of events (like (x and y) OR Z)
When you search, it reads results into ram. Each command is a separate query so results are ‘cleared’ when removed.
Piping#
Once you have created your search, you will want to filter the results or display them in a readable way.
RENAME : renames a table result
DEDUP : removes duplicates based on a key (or key column)
FIELDS : only show the specific fields from the results
TABLE : show a table of the specified fields
Sort : sort by a field (such as time). You can also reverse the order by Sort -time (for example)
User Accounts#
Theres multiple leves for the web portal. Main ones are Power and User.
The default account is setup during first run (above)
Forwarders#
As above, forwarders send data to splunk. A SIEM isnt much help if it doesnt have data to analyze.
Set up a reciever in splunk. This will open the port for the forwarder to send data to. This can be done in Settings -> Forwarding and Recieving -> Recive Data. Add the port (9997 by default.)
Install the forwarder. This is as simple as grabbing the msi and running, or doing a silent install over terminal. There are two options for how to deploy, via a deployment server or recieving indexer. I went with the later. It will also ask for an account, this is for the FORWARDER, not the target.
Configure the config files. In windows. these are in <install>/etc/system/default (or in apps if youre using multiple)
inputs.conf
This is how the forwarder collects data (and what)outputs.conf
How the forwarder sends to the indexer.server.conf
Connection, performance and tuning.deploymentclient.conf
If you’re using a deployment server.
Unfortunately, there is more to it than this. THere are multiple ‘apps’ within the forwarder that can be configured differently
Forwarding Network Traffic#
So, I spent forever looking for this. In the inputs.conf file (default directory above)
Add a stanza:
[WinNetMon://<WhatSourceYouWant>]
index = <yourIndexHere>
For me, this became
[WinNetMon://NetworkTraffic]
index = domaincontrollers
As you can guess, this resulted in a LOT of events.
Deployment Server Recieving Indexer
Helpful Glossary#
Stanza#
A stanza is a config block consisting of a text field enclosed in [] followed by Key value configuration pairs.
[best_config] BlockHackers = True DollarsSaved = 999 BackdoorsMissed = None index = tellEveryone
Index#
An index is like a database in a DB server. It holds a collection of data against a defined topic. There are a number of defaults but you can make your own. Forwarders send data to the indexer who assigns the event to an index. You then search based on an index. While it’s perfectly possible to send everything custom to one, it’s not as efficient as it can bloat. Retention settings are also per index.
Threat Hunting with Splunk#
Starts the same a DFIR, but we just dont have a specific target to look for
Check for high traffic loads from single devices (index = MyIndex src_ip=’IP Address’)
Can view the immediate results in the search page, or pipe to a table (table col1 col2 etc). Helpful fields could be the user agent (for scripted connections), src_ip etc
Brute forces can be found with form_data=*username*passwd* (wildcard searches)
Can search for .exe files
To get the filename, the field may not be shown. Try “additonal fields” at the end of the search column and search ‘file’ For “evidence of execution”, add the source (XmlWinEventLog) and the EventCode for exectution (eventCode=1). Add Commandline for further details https://www.robtex.com/ -> threat intel https://otx.alienvault.com -> More threat intel